Launching Light Into Step-Index Multimode Fibers
Posted on 2023-01-24 as part of the Photonics Spotlight (available as e-mail newsletter!)
Permanent link: https://www.rp-photonics.com/spotlight_2023_01_24.html
Author: Dr. Rüdiger Paschotta, RP Photonics AG
Abstract: Details of launching light into a step-index multimode fiber are discussed and demonstrated with various numerical simulations. Various surprising findings can be explained well.
Content quality and neutrality are maintained according to our editorial policy.
Multimode fibers as used e.g. for transporting light from some light source to an application are often step-index fibers, i.e., they have a constant refractive index throughout the fiber core. Although this is a rather simple configuration, there are still some phenomena which are surprising and can often be understood only using wave optics, i.e., not with geometrical optics alone. Also, some questions are often encountered in practice, which are often not answered in typical textbooks. Some of those issues are addressed in this article.
Same Optical Power in All Guided Modes?
Some questions are related to the distribution of optical power over the guided modes of the fiber — which of course depends on the launch conditions.
A first question could be how the optical fields look like if we somehow manage to achieve the same optical power in every mode. Interestingly, further specifications are needed to make clear what exactly that means: do we mean monochromatic light, where the electric fields corresponding to all modes are oscillating in synchronism, or polychromatic light?
Let us assume the second case, which is surely of higher practical importance. The simplest assumption for the polychromatic case is that we have no coherence at all between the fields of individual modes. The total intensity profile (e.g. in the fiber or somewhere after the fiber) is then simply the sum of all intensity contributions of the different modes with no interference effects. With partial coherence, things would become substantially more complicated.
I use our RP Fiber Power software for the following investigations. Initially, I assume a fiber with 15 μm core radius and a numerical aperture of 0.2, and a wavelength of 940 nm. The fiber turns out to have 56 guided LP modes, or 105 when separately counting two different orientations for each mode with non-zero ($l$) index.
It is simple to add up the intensity profiles of all the modes. First the near field intensity distribution, to be found within the fiber (or directly after the fiber):

We don't get a perfectly flat intensity profile, but some approximation of it — nothing surprising.
Now the far field profile, i.e., for light propagating a long distance in free space after the fiber:

The limit angle is as expected for the given NA of 0.2, but the profile looks a little strange: One may again have expected an approximately flat profile, but what is that peak at the center? Is that perhaps just some effect obtained for cases with relatively few modes? But with twice the mode radius (30 μm, leading to a V-number of 40.1), where we get 211 modes (409 counting different orientations), things get even more extreme:

I was myself somewhat surprised and then wondered which modes were associated with that peak. Maybe some low-order modes because high-order modes are generally expected to exhibit a high divergence, not producing such peaks at rather small angles? But no, it turned out be a mode with a very high order. Here are the five highest-order modes (i.e., those with lowest propagation constants):

You see that it is LP1,13 causing that strong peak, while the others don't contribute much. To understand that, we must look at the corresponding near field profiles:

The key point is that the LP1,13 mode, being close to its cut-off wavelength, has an intensity profile which extends relatively far into the fiber cladding — a phenomenon which can be understood only with wave optics. That relatively broad spatial component leads to that far field contribution with low divergence.
So this is understood, but could we get that in practice with realistic launch conditions? If our input light is restricted to the area of the fiber core, that mode extending more into the cladding will get less overlap with the input light distribution and therefore get less optical power. So the observed effect should at least be substantially weaker.
Simulation of Launch Conditions
It is certainly of interest to simulate certain typical launch conditions. That is technically somewhat more tricky — how to construct a light field with limited coherence, exhibiting some degree of correlations between neighboring locations in the profile?
With our RP Fiber Power software, one can solve that problem quite easily with the following approach, implemented with a little script code:
- Create a 2D array for complex field amplitudes at the fiber end with a suitable spatial resolution.
- As the “first guess”, make random uncorrelated complex amplitudes on all grid points, where the expectation value of the intensity (modulus squared of amplitude) follows a super-Gaussian function of order 10, fitting reasonably well to the fiber core. With its fast spatial variations, that field would have a very strong beam divergence, far extending beyond the NA of the fiber.
- In order to correct for the latter, do a 2D spatial Fourier transform, multiple the result with a super-Gaussian function to limit it according to the given NA, and transform back.
From the obtained random amplitude distribution, we can then calculate all mode powers with overlap integrals, involving the mode amplitude profile and the random amplitude profile. We can show the result graphically:

Here, we use positive ($l$) indices for LP modes with the “cosine” orientation and negative ($l$) indices for LP modes with the “sine” orientation.
The total power of all modes reached 99.2% of the launched power. Obviously, 0.8% of the launched power gets into cladding modes. That loss could be reduced by restricting the spatial and/or angular range of the input field a little more.
That diagram of course still contains strong fluctuations from run to run due to the random calculation. Therefore, we now do the same but with averaging the powers over 100 runs:
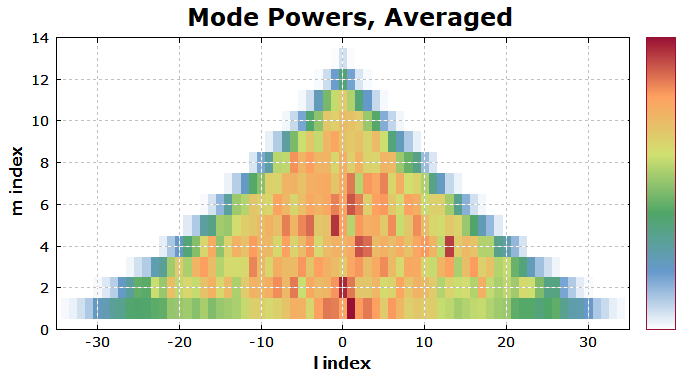
This shows that we have a fairly even distribution of powers, except for the highest-order modes, which have less power. And the above-mentioned LP1,13 mode even got only 248 μW per 1 W of incident power, far less than the average of 3.55 mW.
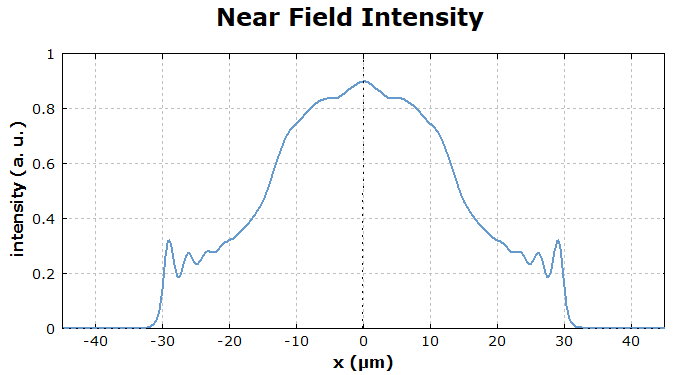
Now it is also of interest to see the near and far field calculated from these averaged mode powers (plot a slice of the field intensity in ($x$) direction): The near field profile is still roughly flat; it would become more flat with more averaging:

The far field is also roughly flat, except for some structure near the center:

We can also simulate what happens if we launch light with a divergence which uses only half that of the NA of the fiber. The averaged mode powers are now substantial only for smaller ($l$) and ($m$) indices:

The near and far field distributions are not substantially changed, except for the reduced far field divergence:


Another interesting test is when we again go to the NA limit of the fiber, but reduce the input beam diameter to half its original value:


Some explanations for those results:
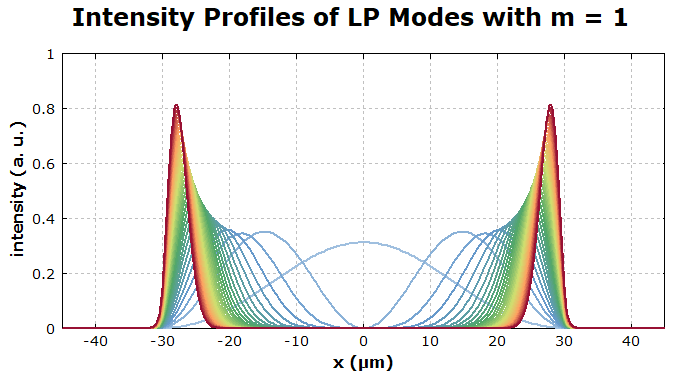
- The pattern of mode powers is now quite different e.g. from that for launching on the full core area but with limited divergence. It may be surprising to see that power distribution — for example, that of those modes with ($m = 1$) we get only those with the smallest ($l$) values. That is simply because those modes have significant intensity only relatively far away from the fiber axis. The following diagram shows their profiles, where the red color corresponds to the highest ($l$) value:
- The next surprise may be to see substantial near field intensities throughout the fiber core. That we would not see directly after the input end, where we inject light only into the center region. However, we would still excite many modes which also have some intensity out there, and that would be seen after a short distance of propagation (order of 0.2 mm): the light has some divergence, and before it reaches the core/cladding interface, nothing stops it from expanding further. We can investigate that with numerical beam propagation:

The latter diagram is actually only for one monochromatic component; averaging over 100 such components could also be done with a little more coding if required.
- Further, we get a narrow peak at the center of the far field distribution. That is associated with the fundamental mode LP01, which now gets a relatively high power.
Note that we always implicitly assumed there is no mode mixing. We could also simulate with numerical beam propagation what happens if we propagate that light in an arbitrarily bent fiber, or in a fiber with random refractive index fluctuations.
Final Remarks
Those simulations of launching light involve a heavy computational load: we have to compute hundreds of modes with their complex amplitude functions, generate random input fields, calculate overlap integrals, and even do much of that many times for getting averaged results. Nevertheless, the calculations could be performed in a quite reasonable time — one run taking less than 30 seconds — thanks to the Numerical Power Package which uses the CPU so efficiently.
The author thanks Johan Nilsson from the ORC Southampton for discussions which triggered some interesting ideas.
This article is a posting of the Photonics Spotlight, authored by Dr. Rüdiger Paschotta. You may link to this page and cite it, because its location is permanent. See also the RP Photonics Encyclopedia.
Note that you can also receive the articles in the form of a newsletter or with an RSS feed.