Case Study: Amplified Spontaneous Emission in Ytterbium-doped Fibers
Key questions:
- What happens when an Yb-doped fiber is pumped at either 940 nm or 975 nm, concerning both ASE and pump saturation effects?
- What are the effects of weak end reflections?
Amplified spontaneous emission (ASE) is a phenomenon that is very relevant for the operation of fiber amplifiers. While the basic principle is relatively easy to understand, various dependencies and effects of ASE on the amplifier performance are somewhat complicated. For example, we have to deal with consequences of quasi-three-level characteristics and with strong saturation effects. In this case study, we qualitatively and quantitatively investigate ASE phenomena in ytterbium-doped fibers. (Various aspects occur in similar form in other active fibers, e.g. doped with erbium.) We will find a lot of unexpected behavior when we try what happens for pumping at different wavelengths, when we modify the fiber length, or introduce some weak reflection at the fiber end.
For the simulations, we can conveniently use the software RP Fiber Power, which offers the Power Form titled “Fiber amplifier for continuous-wave signals”.
Spectroscopic Data
We consider an ordinary germanosilicate fiber, for which we can use the following wavelength-dependent transition cross-sections:

The main features we see here:
- There is the so-called zero phonon line at 975 nm, a relatively narrow peak where the absorption and emission cross-sections are very similar and quite high. This peak is associated with transitions between the lowest sub-levels of the lower and upper Stark level manifold.
- We have the broader emission peak around 1030 nm, where there is still some absorption. For longer wavelengths, the emission gets weaker, but the absorption drops even faster. Here, we mainly have transitions between the higher sub-levels of the lower manifold and the lowest sub-level of the excited state manifold.
- There is a broad absorption peak around 920 nm, where stimulated emission gets quite weak. This is related to transitions from the lowest sub-level of the ground state manifold to higher sub-levels of the excited state manifold.
You will see that these spectroscopic features are quite relevant for the resulting behavior.
For erbium-doped glasses, we find a similar situation, only that the zero phonon line then is at ≈1535 nm.
Pumping at 940 nm
We work with data for a fiber which is single-mode for all involved wavelengths. Initially, we assume a fiber length of 1 m, which for the chosen doping concentration (a density of 5 · 1025 m−3) allows us to efficiently absorb pump light at 940 nm with 250 mW input power. We do not inject any signal and assume no reflections at the fiber ends.
Inspecting the powers and excitation density along the fiber, we already find a complicated situation, although we simply injected some pump power into a piece of fiber:
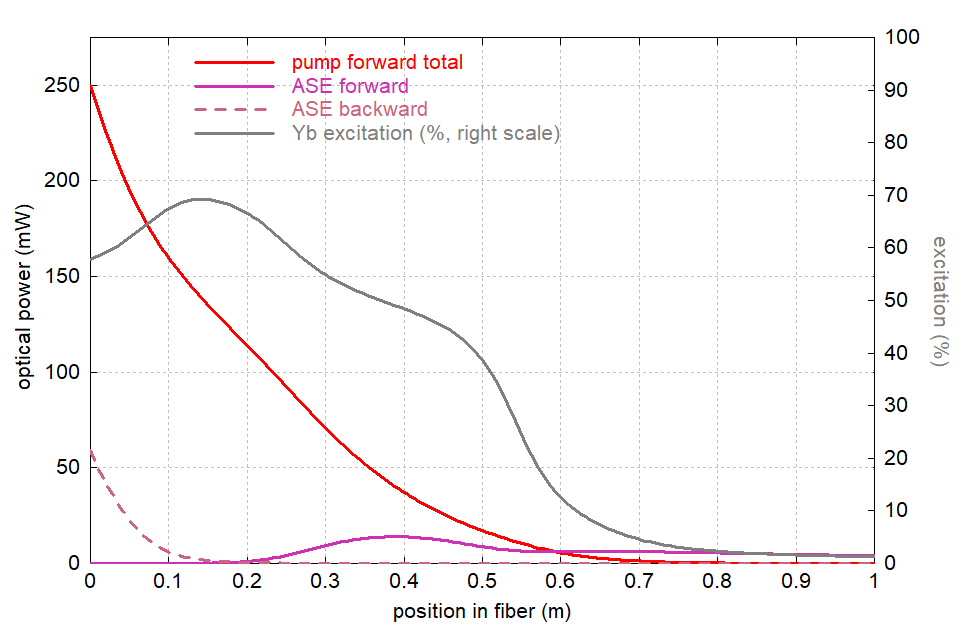
The clearly non-exponential decay of pump power is related to the peculiar shape of the Yb excitation, being highest somewhat after the input end, despite the already reduced pump power. This is because forward and backward ASE saturate the excitation. Of course, the ASE powers themselves depend on this excitation profile; the software has calculated the self-consistent state where the excitation profile is consistent with the pump power distribution and vice versa. This calculation is not trivial to program – especially if the algorithm used is to be reliable and efficient for a wide range of situations.
(For simplicity, we say e.g. “forward ASE” when meaning light generated by ASE in forward direction.)
We also inspect the optical spectra of forward and backward ASE, as they leave the fiber at both ends:
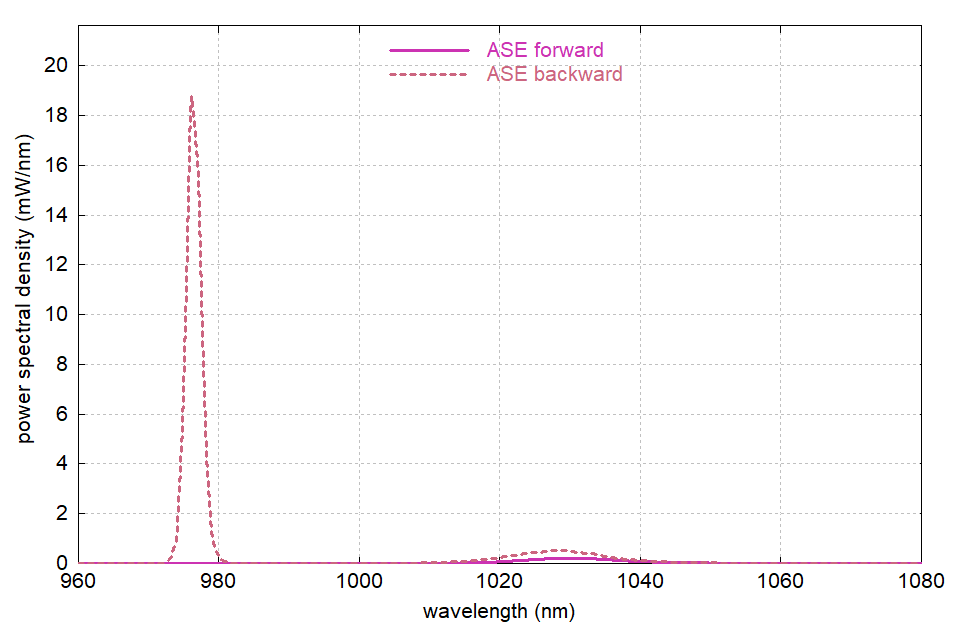
Here, it is surprising that forward and backward ASE have so different characteristics:
- Backward ASE is far stronger, and most of its power is in the 975-nm peak, where we obtain the highest gain.
- Forward ASE does not have that 975-nm peak at all; this is because that ASE is strongly absorbed in the right part of the fiber, where the Yb excitation is weak. It only has the peak around 1030 nm, which is also weaker than that for backward ASE.
How can forward and backward ASE have such different characteristics, even though the total gain for each wavelength is the same for both directions? Well, ASE is not determined by gain alone; it also depends on how the Yb excitation evolves along the fiber:
- Forward ASE first “sees” strong Yb excitation in the first half of the fiber. In the second half, where the Yb excitation is weak, it is partially reabsorbed – especially around 975 nm. (By the way, that reabsorption is responsible for the still significant Yb excitation there, despite the negligible remaining pump power.)
- Backward ASE starts – at a very low level – in the right part of the fiber (meaning the side where the residual pump exits). Although the gain there is low, spontaneous emission builds up some power, which then acts as a seed in the left region, where we have the strong gain. So you can see that the backward ASE (as opposed to the forward ASE) benefits from the right part of the fiber, which is largely unpumped.
So the asymmetry of the Yb excitation is highly relevant to ASE, although the gain for a given signal would be independent of the propagation direction; only the noise figure (related to spontaneous emission into the guided modes) would be affected by the asymmetry.
It is also instructive to show the evolution of ASE with a color scale:
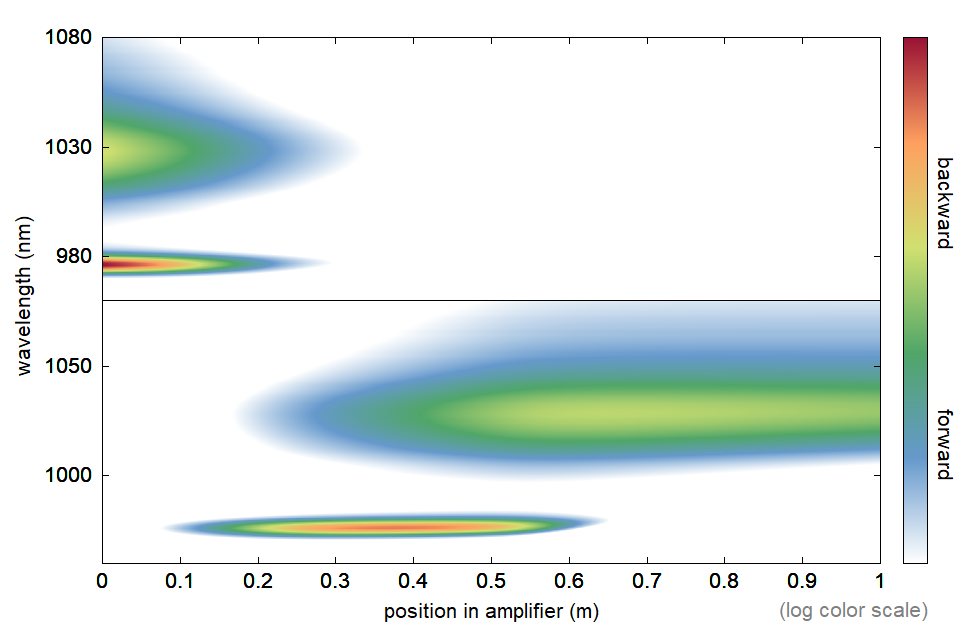
One can easily see how in forward direction we first get some ASE around 975 nm, which, however, is later dying out, while longer-wavelength ASE is growing. In backward direction, this is very different: ASE at both wavelength ranges gets strong near the end.
Pumping at 975 nm
We now change the pump wavelength to 975 nm, where we have the strong zero phonon line. This changes a lot:
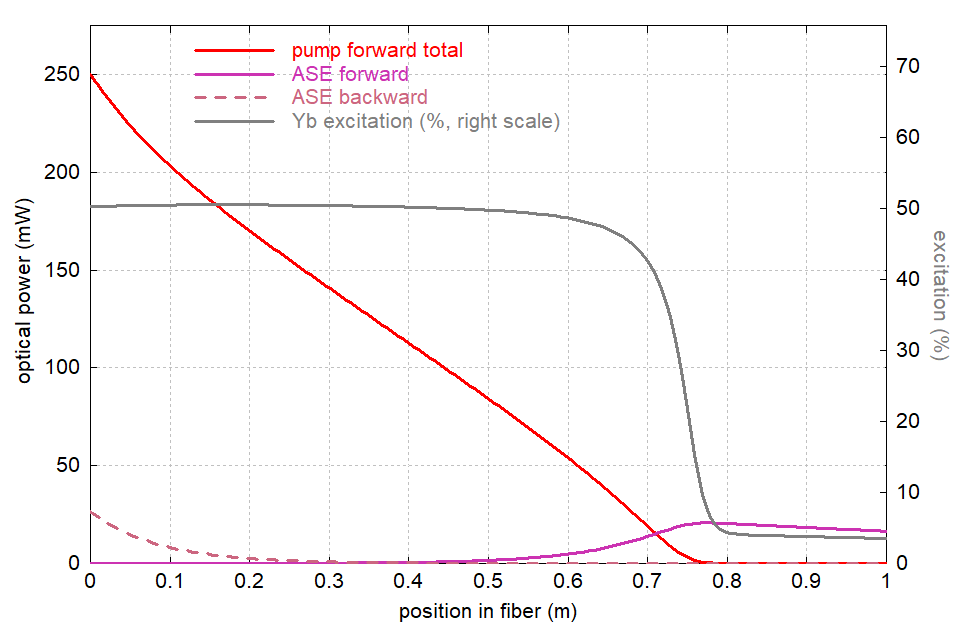
Note the approximately linear decay of pump power, which is typical for 975-nm pumping (without having a signal). The pump saturation power (here: 2.44 mW) is very low due to the high absorption and emission cross-section at 975 nm, in fact far below the pump input power. The fractional Yb excitation remains at approximately 50% until the pump power drops below the saturation power. The decay of pump power is approximately linear because the fiber radiates an approximately constant fluorescence power per centimeter, and only that fluorescence is what allows the fiber to dissipate some of the pump power (neglecting the quantum defect). What else should the Yb ions do with the supplied energy?
Now we again look at the ASE spectra:
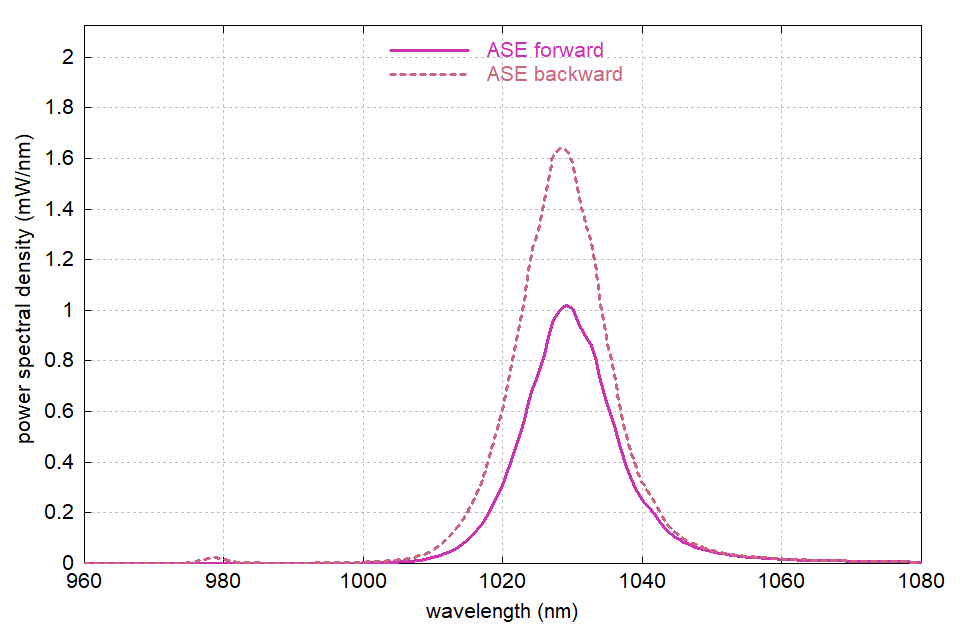
The emission at 975 nm is now very weak. This is because we cannot have positive gain at the wavelength where we are pumping; we only have spontaneous emission. The balance of absorption and stimulated emission caused by the pump light limits the Yb excitation to about 50%, resulting in a slightly negative net gain at 975 nm. (With 940 nm pumping, we can achieve higher Yb excitation despite the lower absorption cross section because the stimulated emission becomes so much weaker).
The difference between forward and backward ASE powers is now much smaller, but again, we have 975-nm ASE only in the backward direction. This difference would become negligible for a reduced fiber length of 0.7 m, where we get ≈50% Yb excitation in the whole fiber. For a 2 m fiber, the asymmetry would be more pronounced:
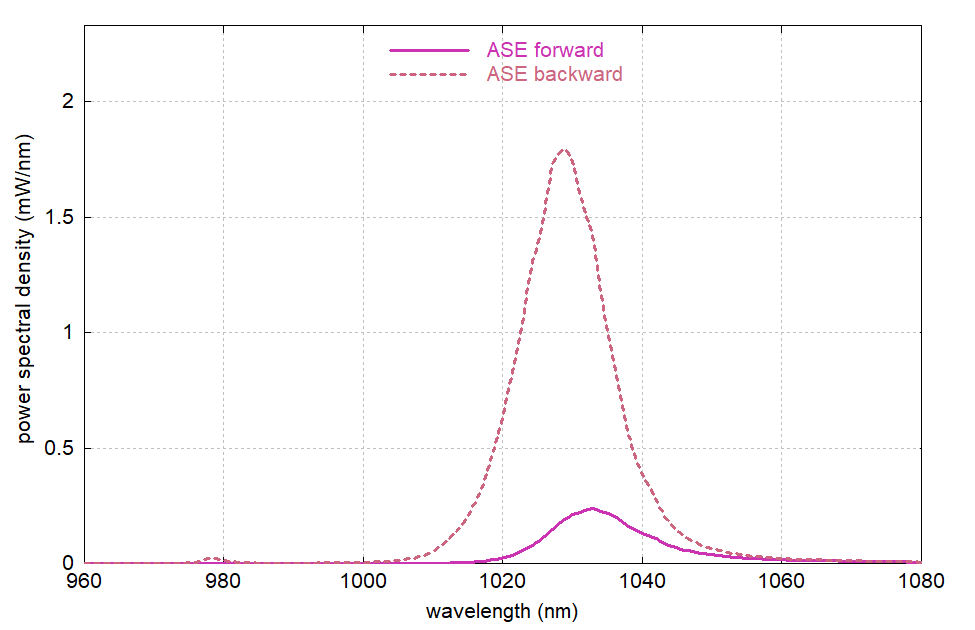
Here, we also see that the peak of forward ASE shifts to somewhat longer wavelengths due to the wavelength-dependent reabsorption.
Again, we show the ASE with a color scale (for the original 1 m length):
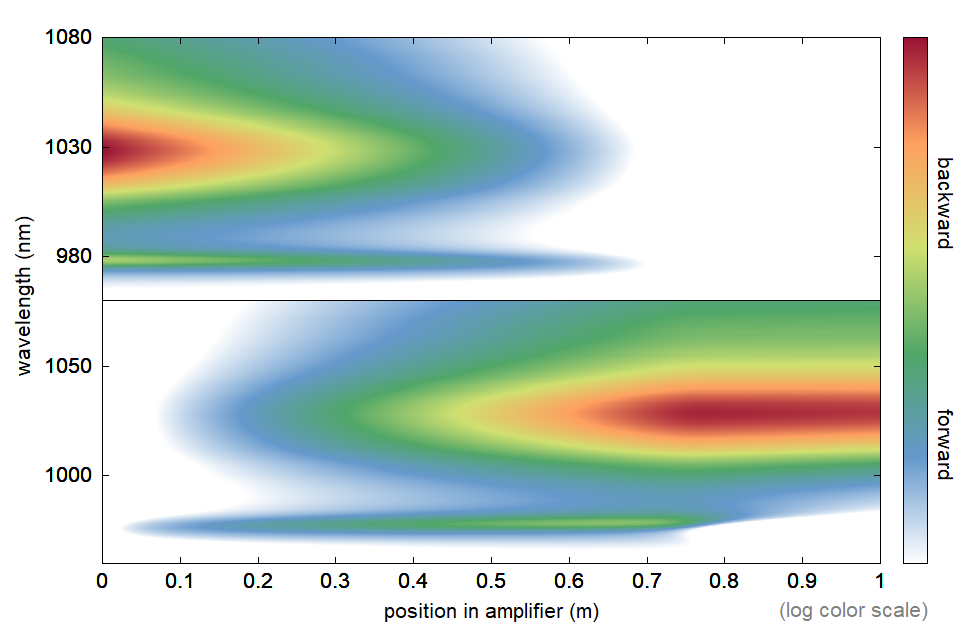
For 975 nm and below, there is no positive net gain, but still some spontaneous emission. Slight amplification occurs at wavelengths slightly above 975 nm, leading to a drift of that peak to somewhat longer wavelengths.
Dependence on the Pump Power
It is also interesting to investigate how the generated ASE powers depend on the pump power. We first do this for pumping at 940 nm and for the original fiber length of 1 m:
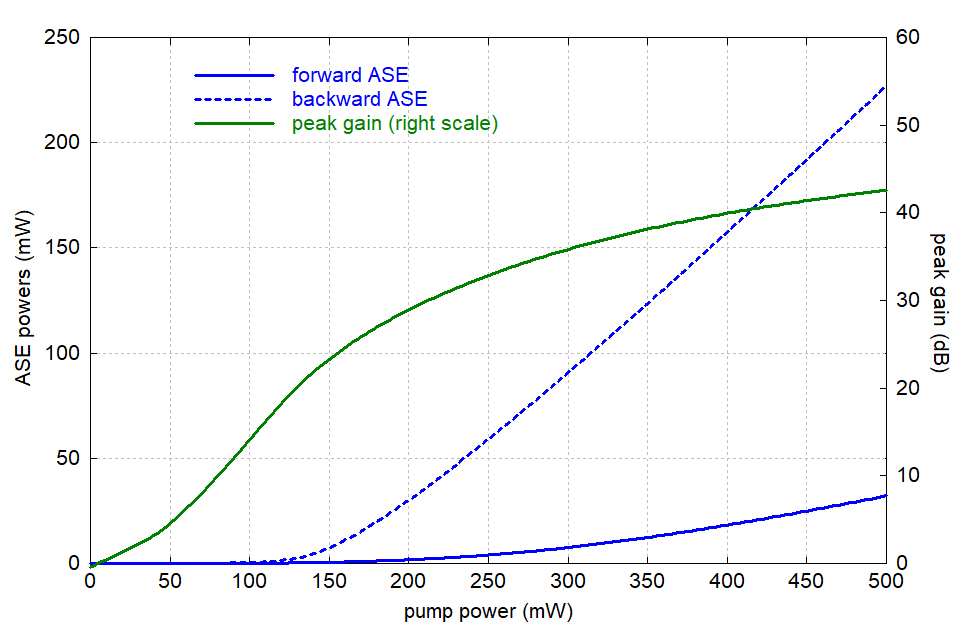
Unlike the situation in a laser, where there is a fairly well-defined threshold pump power, the onset of ASE is somewhat soft, and here we also see that the forward ASE power is not nearly linear.
The green curve shows how the peak gain (in this case at 975 nm) increases with pump power. While a laser gain would strictly saturate to a constant level above the threshold, we see again the soft behavior for ASE; more ASE results from more gain.
For pumping at 975 nm, we again see the smaller difference between forward and backward power:
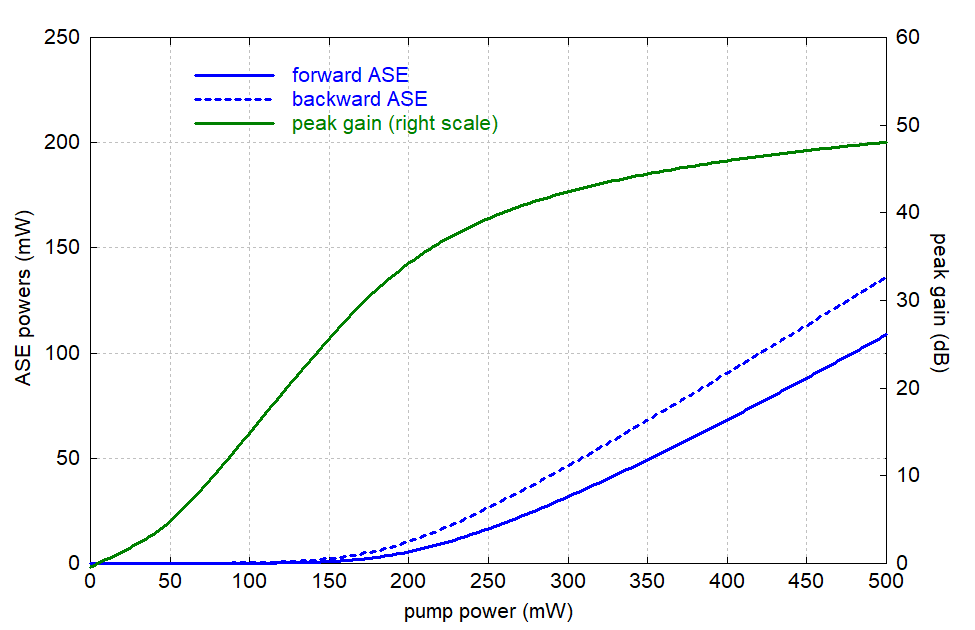
Note that the peak gain is quite similar as before, although it now occurs at a much longer wavelength.
Influence of the Fiber Core Diameter
What happens if we increase the core diameter, e.g. in our case from 8 μm to 12 μm? First of all, the gain efficiency of the fiber will be lower, and with less gain we get far less ASE. We can compensate for this by increasing the pump power from 250 mW to (12 / 8)2 · 250 mW = 562.5 mW; with that, we might expect to get the same gain as before. However, the gain is actually determined not just by the pump power, but also strongly influenced by ASE, causing gain saturation!
When simulating this case (with pumping at 940 nm), we found almost the same results as in Fig. 1, just with all optical powers scaled up according to the larger fiber core area. The ASE output powers were increased from 4.04 mW (forward) and 59 mW (backward) to 5.33 mW (forward) and 124 mW (backward). Peak gain was increased from 32.86 dB to 34.18 dB.
We have implicitly assumed that the fiber remains single mode. For a larger core, we would have to reduce the numerical aperture. This, by the way, also reduces the amount of spontaneous emission captured by the fiber core, and this effect simply compensates for the larger mode area: for the same gain, the larger fiber does not generate more ASE! But if the ASE powers had not increased for the larger core area, the gain would be less saturated by the now lower optical intensities. Therefore, the gain got a bit higher until the now stronger ASE saturated it sufficiently.
As you can see, it is not very easy to predict the exact consequences of such a design change. Without simulation, it is easy to overlook some important details and develop wrong expectations, which may lead to wrong decisions regarding the design of the device.
By increasing the core diameter without decreasing the numerical aperture, we would eventually get into the multimode regime. More guided modes lead to stronger ASE. Detailed modeling of this is a bit trickier, since higher-order modes have less overlap with the doped core, and thus less gain. Thus, they may contribute significantly less (per mode) to the ASE power than the fundamental mode.
By the way, an increase in core diameter will increase the fraction of spontaneously emitted light which is guided by the fiber core, only if the number of guided modes increases. (It thus increases in steps, not continuously.) A purely geometrical reasoning would give wrong results in that respect.
Effect of End Reflections
So far we have assumed that there is no reflection at either end of the fiber. Now we estimate what a weak reflection at the right end (opposite to the pump input end) would change. In a fiber amplifier, for example, this could result from an imperfect mechanical fiber splice. Let us assume that 1% of the output power is reflected and we are pumping at 940 nm.
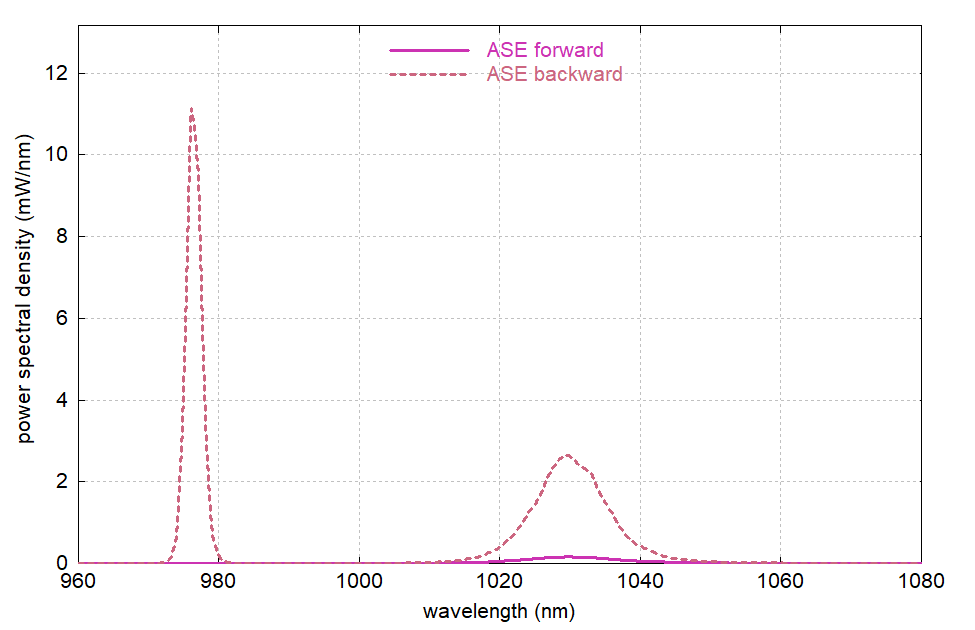
We certainly expected an increase of backward ASE powers, since the reflection provides a seed for backward ASE. Indeed, the backward ASE power rises from 59 mW to 64 mW, but the 975-nm peak now gets substantially weaker; it is only that backward ASE around 1030 nm gets substantially stronger. This is because the overall stronger ASE reduces the Yb excitation, and the gain at 975 nm reacts most sensitively to that.
If we spectrally limit the reflection to wavelengths below 1000 nm (by entering 1 * (l < 1000 nm) in the input field for the reflectivity, set to percentage values), this has no effect at all – this is because we have very low Yb excitation at the right end and thus strong absorption around 975 nm. So there is nothing to reflect there! However, this would change significantly if we shortened the fiber length to, say, 0.5 m to avoid the unpumped section at the end of the fiber.
We also check what the 1% reflection does for the case of pumping at 975 nm:
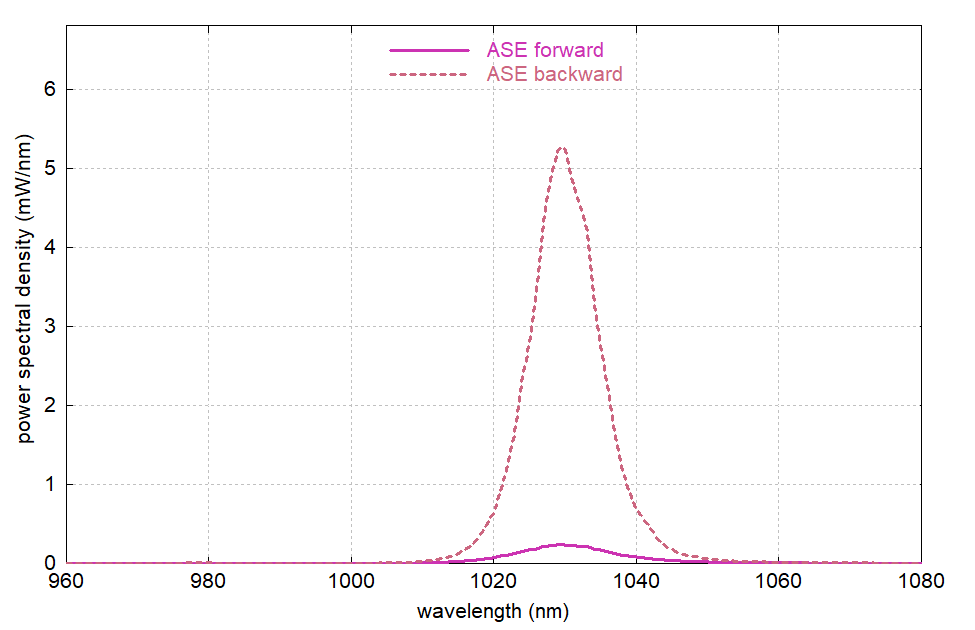
Here the backward ASE becomes several times stronger than without reflection. While forward ASE at the output experiences only 1% direct power loss from the reflection, it is significantly attenuated because the stronger backward ASE saturates the Yb excitation more.
Conclusions

The RP Fiber Power software is an invaluable tool for such work – very powerful and at the same time pretty easy to use!
You can learn various things from this study:
- Even in seemingly simple cases, ASE in fiber amplifiers can give rise to quite unexpected behavior.
- For example, ASE may be reabsorbed in parts of the fiber and thus support gain at longer wavelengths.
- For different pump wavelengths, ASE phenomena can be very different.
- Strong ASE, dissipating a substantial part of the injected power, arises if the gain gets too high – but with a “soft” threshold.
With a simulation model, you can identify such effects quickly and have the best chances to find out how things really work.
Bibliography
| [1] | R. Paschotta et al., “Ytterbium-doped fiber amplifiers”, IEEE J. Quantum Electron. 33 (7), 1049 (1997); https://doi.org/10.1109/3.594865 |
See also our encyclopedia articles on amplified spontaneous emission, ytterbium-doped laser gain media and fiber amplifiers.

Connect and share this with your network:
Follow our specific LinkedIn pages for more insights and updates: